PMF IAS Current Affairs

Current Affairs for UPSC Civil Services Exam – April 19, 2024

{GS1 – A&C – Architecture} Fort Emmanuel/Fort Kochi

  • Context (TH): As visitors increase, history buffs want steps to conserve the laterite-brick remnants of Fort Emmanuel, which the Portuguese built along the beachfront in 1503.
  • Fort Kochi was built on the beachfront, which saw the footfall of three colonial powers — the Portuguese, the Dutch, and the English.

About Fort Emmanuel

  • It is a ruined fort located at Fort Kochi Beach in Kochi, Kerala.
  • It was a symbol of the strategic alliance between the Maharajah of Kochi and the Monarch of Portugal, after whom it was named.
  • It was initially built in 1503 and reinforced in 1538.
    • In September 1503, Afonso de Albuquerque received permission from the King of Kochi to build Fort Emmanuel along the Arabian Sea waterfront.

https://lh7-us.googleusercontent.com/jaDuIb_b6ThWceR_ez9zWCWvbRo-tFg_hVznEgZOpXLGz0AOS9WHzBPJelI_6Z-_-LY05A_bjkIDQM8F-Jewnk6aSiS4tu2ox6GSYYtbn__-x9l9Q8pgqKsC_DKbHwW3Cov0Bto0JafXCrCwNrKD5w=s2048

  • The fort, which was a Portuguese bastion, began from Bastion Bungalow, which is now a heritage museum and continued to the southern end of the beach, from where INS Dronacharya, the Indian Navy’s gunnery school, began.
  • It is estimated that there were many bastions on the fort.
  • It was a massive structure, and the entire township was within its confines.
  • Most remnants of the fort remain submerged along the coast.
  • It immensely helped strengthen the Portuguese occupation of the area.
  • Fort Kochi remained in Portuguese possession until 1683 when the Dutch colonial troops captured the territory and destroyed the Portuguese institutions.
  • The Dutch held the fort in their possession until 1795 when the British took control by defeating the Dutch.
  • By 1806, the Dutch and later the British had destroyed most of the fort walls and bastions.
  • Foreign control of Fort Kochi ended in 1947 with Indian independence.

India - Kerala - Fort Cochin - Steam Boilers Of Cranes - 1… | Flickr

Why did the Portuguese build forts in coastal areas?

  • Portuguese built Fort in Kochi, Goa, Kollam, Kozhikode, and Kodungalloor.
  • It was part of their strategy since their colonies were mainly in coastal regions protected by forts.
  • They also had a formidable navy, with cannons fitted atop the deck of ships.
  • This gave them a decisive advantage in battles with the forces of, among others, the Zamorin of Kozhikode, Chhatrapati Shivaji, and the Sultan of Bijapur.
  • While the personnel of the other navies had to return to the land every night after the battle, the Portuguese could fight even at night.
  • From Kerala, they wanted to carry back to their homeland the best of pepper and other spices, and this type of fortification of colonies helped repel attacks.

{GS2 – IR – China} India’s South China Policy

South China Sea - PMF IAS Nine Dash Line - PMF IAS

  • India also called on China to adhere to the rules-based maritime order and acknowledge the International Court of Justice‘s 2016 ruling in favour of the Philippines.

Policy Imperatives

  • Economy-driven policy: Initially guided by Look East policy, aimed to enhance economic integration with Southeast Asia and the imperative to secure energy resources to fuel its growing economy.
    • For example, the Oil and Natural Gas Corporation’s overseas arm (ONGC Videsh) is participating in oil and gas exploration projects in Vietnam’s exclusive economic zones (EEZs).
  • Freedom of navigation, exploration and exploitation: India supports it within the bounds of international law, specifically the United Nations Convention on the Law of the Sea (UNCLOS).
  • Act East Policy: It emphasises economic integration, strategic partnerships, and expanded security cooperation with countries in the Indo-Pacific, including Vietnam, Malaysia, Singapore, and the Philippines.
  • Capacity enhancement: Forward positioning, mission-based deployments, reinforced maritime domain awareness, and deep-water maritime facilities have improved India’s capacities.
  • China-India relations: China’s assertive posture and territorial claims in the South China Sea and along India’s land border also influence India’s policy.
  • ASEAN factor: ASEAN centrality in India’s Indo-Pacific strategy also makes it imperative for India to bolster the ASEAN position.
  • Responsible stakeholder: India’s vocal stance against unilateral actions indicates its responsible role in regional stability and security.

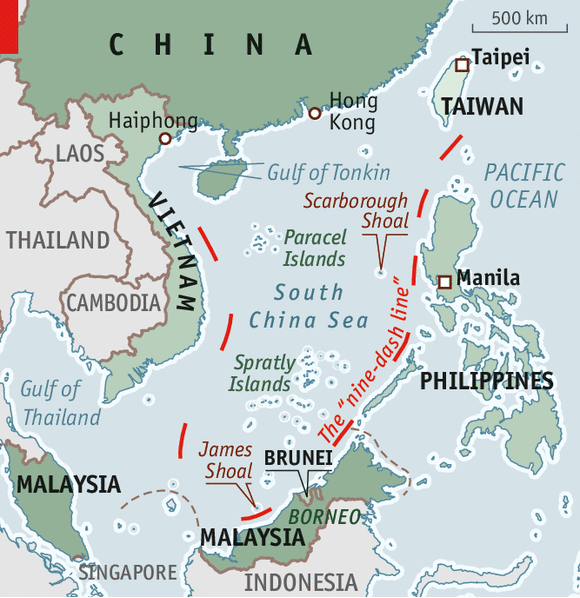
For more details, visit > South China Sea.

{GS2 – IR – Middle East} India’s Trade with Israel and Iran

  • Context (IE): An escalation in Middle East has the potential to influence trade and markets in India.

India-Israel Trade

  • Growing since 1992: India-Israel trade has doubled in the last five years and risen significantly, from $200 mn in 1992 to $10.7 bn (excluding defence) in the Financial Year 2022-23.
  • Trade surplus of $6.13 bn: India’s exports to Israel were worth $8.45 bn, while India’s imports from Israel stood at $2.3 bn.
  • Israel’s share in India’s total trade: Israel comprised 0.92 per cent of India’s total trade during FY 2022-23, making it India’s 32nd biggest trading partner.
  • India’s share in Israel’s total trade: India is Israel’s second-largest trading partner in Asia and the seventh-largest globally.
  • India’s exports to Israel: Diesel and diamonds (78% of exports in 2022-23), aviation turbine fuel, radar apparatus, Basmati rice, T-shirts, and wheat.
  • India’s imports from Israel: Space equipment, diamonds, potassium chloride, mechanical appliances, turbo jets, and printed circuits.

India-Iran Trade

  • Declining trade: The value of the India-Iran trade has declined in the last five years, except for an uptick in FY 2022-23, mainly due to US sanctions on Iran.
  • Trade surplus of $1 bn: In 2022-23, India’s exports to Iran accounted for $1.66 billion, while India’s imports from Iran stood at just $0.67 billion.
  • Iran’s share in India’s total trade: During FY 2022-23, bilateral trade was 0.20 per cent of India’s total trade. Iran was India’s 59th biggest trading partner.
  • India’s exports to Iran: Agricultural goods and livestock products, including meat, skimmed milk, buttermilk, ghee, onions, garlic, and canned vegetables.
  • India imports from Iran: Methyl alcohol, petroleum bitumen, liquified butanes, apples, liquified propane, dates, and almonds.

Foreign Direct Investment (FDI) Equations

  • Israel is not a very significant source of investment for India, with only 0.4 per cent ($288 million ) of the total FDI inflows between April 2000 and December 2023.
  • Cumulative Overseas Direct Investment (ODI) from India to Israel from April 2000 to May 2023 was around US$ 383 million.
  • India has invested heavily in various Iranian projects like the Shahid Beheshti Port at Chabahar.
  • FDI inflows from Iran to India were recorded at just $1 million from April 2000 to December 2023.

Economic impacts of Israel-Iran tensions on India

  • Petroleum prices: No direct impact is expected, as major producers like the USA, Russia, and North Sea operators are not in the conflict zone. However, the worsening Red Sea situation can sour the prices.
  • Project delays: Projects like the India-Middle East-Europe Economic Corridor (IMEC) can get delayed.

{GS2 – Social Sector – Health – Issues} Added Sugars

  • Context (IE): Leading food and beverage brand Nestlé’s products for babies in Asia, Africa and Latin America were found to contain added sugars, while the same products sold in Europe did not have it, according to a recent report.

Added Sugars - PMF IAS

  • Sugar is a simple carbohydrate. Some food items have sugar that is naturally occurring.
  • According to the American Heart Association (AHA), Sugar is “found in milk (lactose) and fruit (fructose). Any product that contains milk (such as yogurt, milk or cream) or fruit (fresh, dried) contains some natural sugars.

Added Sugars

  • Free sugar or added sugar is added separately to a food item during preparation or processing. It can “include natural sugars such as white sugar, brown sugar and honey, as well as other caloric sweeteners that are chemically manufactured (such as high fructose corn syrup)”.
  • The Daily Value for added sugars is 50 grams per day based on a 2,000 calorie daily diet.

Added Sugar in Food: Study

  • A UNICEF-supported study from December 2023 found that of the 1,600 infant cereals, snacks and ready-to-eat meals marketed at young children in Southeast Asia, nearly half of the products (44 per cent) included added sugars and sweeteners.
  • A 2019 WHO study on baby foods also found that many products have “inappropriately high levels of sugar. 

Why are added sugars harmful?

  • Excessive consumption of Sugar can lead to increased overall energy intake increasing the risks of contracting non-communicable diseases, such as diabetes, obesity and heart-related ailments
  • Adding sugar to a food item makes it more palatable, meaning consumers will opt for it repeatedly.
  • When added to food for babies and younger children, they get used to sweet taste and start looking for more sugary foods, starting a negative cycle that increases the risk of nutrition-based disorders in adult life.
  • Tooth decay is also associated with early exposure to sugar.

{GS2 – Social Sector – Health – Issues} Infectious Respiratory Particles (IRPs)

  • Context (TH): WHO terms pathogens that transmit through air ‘infectious respiratory particles’.
  • With this, the world health body has ended the lack of a common terminology to describe the transmission of these pathogens, which was particularly challenging during the global COVID-19 pandemic.
  • The pathogens include those that cause respiratory infections, for example, COVID-19, influenza, measles, Middle East Respiratory Syndrome (MERS), Severe Acute Respiratory Syndrome (SARS), and tuberculosis (TB), among others.
  • IRPs exist on a continuous spectrum of sizes, and no single cut-off points should be applied to distinguish smaller from larger particles.
  • This facilitates moving away from the dichotomy of previously used terms, ‘aerosols’ (generally smaller particles) and ‘droplets’ (generally larger particles).
  • The descriptor ‘through the air’ can be used in a general way to characterise an infectious disease where the main mode of transmission involves the pathogen travelling through the air or being suspended in the air.
  • Under the umbrella of ‘through the air transmission’, two descriptors can be used:
    1. Airborne transmission or inhalation, for cases when IRPs are expelled into the air and inhaled by another person. Airborne transmission or inhalation can occur at a short or long distance from the infectious person and distance depends on various factors (airflow, humidity, temperature, etc).
    2. Direct deposition, for cases when IRPs are expelled into the air from an infectious person, and are then directly deposited on the exposed mouth, nose or eyes of another person nearby, then entering the human respiratory system and potentially causing infection.

{GS3 – Envi – Degradation} Arctic’s Plastic Crisis

  • Context (DTE): A report titled “The Arctic’s Plastic Crisis: Toxic Threats to Health, Human Rights, and Indigenous Lands from the Petrochemical Industry” was released.
  • It was released by Alaska Community Action on Toxics (ACAT) and the International Pollutants Elimination Network (IPEN).
  • The Arctic is becoming a ‘hemispheric sink’ for chemicals & plastics accumulating from various sources.
  • The estimated 13 million inhabitants of the Arctic, who come from 40 ethnic groups, are at risk from plastics, chemicals, and climate change.

Arctic: Issues caused by warming and plastics

  • Grasshopper effect: Chemicals and plastics are transported to the region on atmospheric and oceanic currents from lower latitudes through a process known as global distillation.
  • Thermal pollution: The burning of fossil fuels globally exacerbates the devastating consequences of climate warming, exceptionally faster warming in the Arctic, leading to the release of toxins.
  • Local sources: The region suffers a long history of colonisation and the exploitation of local natural resources, especially by the petrochemical industry, with a track record of environmental violations.
  • Oil spills: Oil spills and releases of hazardous substances harm the environment and threaten Arctic Peoples’ health.
  • Positive feedback loop: Climate warming and melting sea ice in the Arctic are opening new areas for exploration and development, leading to potential degradation in future.
  • Impact on Indigenous community: They are facing climate-induced displacement, food security issues and loss of sacred places and cultural practices.

Global Plastic Treaty

  • It was formed by a United Nations resolution.
  • Objective: Development of a circular economy to address plastic pollution globally.
  • An intergovernmental negotiating committee (INC) is working on an internationally legally binding treaty, with the fourth round (INC-4) to take place in Ottawa in April 2024.

Way Forward

  • Just Transition framework: The report advocates a transition from an extractive to a regenerative economy fostering healthy, equitable communities.
  • Environmental sustainability: Petrochemical industries operating in the region must adhere to the sustainable production process.
  • Fossil fuels subsidy rationalisation: The report recommends ending government subsidies to the fossil fuel and petrochemical industries and supporting clean, renewable energy and a toxics-free economy.

{GS3 – Envi – Degradation} Per-and Polyfluoroalkyl Substances (PFAS)

  • Context (TH): The National Green Tribunal (NGT) has expressed concerns about the presence of ‘forever chemicals’ (per-and polyfluoroalkyl substances (PFAS)) in Chennai waterbodies.
  • According to the study, groundwater near the Perungudi dumpyard contained 2.72 nanograms per litre (ng/L) of perfluorooctane sulfonic acid (PFOS), significantly exceeding the EPA’s safe level of 0.02ng/L.
  • Per-and polyfluoroalkyl substances (PFAS), also known as Forever Chemicals, are man-made chemicals used to make nonstick cookware, water-repellent clothing, stain-resistant fabrics, cosmetics, firefighting forms and products that resist heat, oil, stains, grease, and water.
  • PFAS have a wide range of different physical and chemical properties. They can be gases, liquids, or solid high-molecular-weight polymers.
  • They are stable under intense heat. Many of them are also surfactants and are used, for example, as water and grease repellents.
  • Some of the major industry sectors using PFAS include aerospace and defence, automotive, aviation, food contact materials, textiles, leather and apparel, construction and household products, electronics, firefighting, food processing, and medical articles.
  • Many PFAS, including perfluorooctane sulfonic acid (PFOS) and perfluorooctanoic acid (PFOA), are a concern because they:
    1. Do not break down in the environment,
    2. Can move through soils and contaminate drinking water sources,
    3. Build up (bioaccumulate) in fish and wildlife.
  • PFAS persists in the environment, and exposure in people can occur when they consume PFAS-contaminated water or food.
  • Chronic exposure to PFAS has been linked to decreased fertility, developmental effects in children, interference with body hormones, increased cholesterol levels and increased risk of some cancers.

{GS3 – Envi – Plastic Pollution} Plastic Overshoot Day Report

  • Context (DTE | BS): India is among the 12 countries responsible for 60% of mismanaged plastic waste, as per the Plastic Overshoot Day Report.
  • Plastic Overshoot Day Report is released by Swiss non-profit Earth Action (EA).
  • For 2024, Plastic Overshoot Day is projected to occur on September 5th, marking the point when plastic waste produced surpasses the planet’s waste management systems.
  • Each country has its own Plastic Overshoot Day, determined by the amount of plastic waste generated and the country’s capacity to manage it. India will reach its Plastic Overshoot Day on April 23.
  • Plastic Overshoot Day aims to offer insights into interventions that countries can use to reduce overall plastic waste and in particular, mitigate mismanaged plastic waste, therefore prolonging the country’s overshoot date.

Key Highlights

  • In 2024, nearly 70 million tons of plastic will end up in nature due to imbalance between the volumes of plastics consumed and the capacity to manage the plastic at the end of its life.
  • Plastic waste has risen by 7.11% since 2021.
  • The global average plastic waste generated by person and per year is 28 kg, with a total worldwide generation of 220 million tons per year.
  • By April 2024, almost half (47%) of the world’s population will be living in areas where plastic waste has already exceeded the capacity to manage it.
  • Countries are classified into 6 different archetypes to help readers understand how each country fits into the plastic waste management ecosystem, with associated recommendations tailored to each archetype’s unique circumstances.
Country archetype Country example
The Moderate Polluters Russian Federation
The Overloaders Australia
The Low-Waste-Producing Polluters Ghana
The Toxic Waste Producers Qatar
The Transactors The Netherlands
The Self-Sustainers Colombia

Plastic Waste - PMF IAS

  • Since 2021, POD has been pushed a little closer to December every year by a few days, indicating a slight improvement in global waste management.

Plastic Waste - PMF IAS

  • However, there has been a consistent rise in global plastic waste generation, from 205,948 kilotons in 2021 to 220,606 kilotons projected in 2024.
  • 12 countries are responsible for 60% of the world’s mismanaged plastic waste: China, India, Russia, Brazil, Mexico, Vietnam, Iran, Indonesia, Egypt, Pakistan, United States and Turkey.

Plastic Waste - PMF IAS

Mismanaged Waste Index (MWI)

  • The mismatch of waste management capacity versus plastic consumption is called the Mismanaged Waste Index (MWI).
  • Globally, in 2024, a staggering 31.5% of plastic waste will be mismanaged at the end of its life, with the risk of this waste ending up in oceans.
  • India’s rank in the MWI has improved significantly since 2023. It ranked fourth in MWI 2023 with 98.55 per cent of generated waste being mismanaged, has now improved and is at the 95th position.
  • However, 68.62% of plastic waste generated in India is still being mismanaged. Of around 10.8 million tonnes of plastic waste produced in 2024, nearly 7.5 million tonnes were estimated to be mismanaged.
  • Still, India’s mismanaged plastic waste will be less than one-fifth of China & one-third of the US.

Glossary

The Moderate Polluters
  • Moderate Polluters tend to have a medium plastic waste generation level. Half of them have exported some of their waste.
  • These countries do not effectively manage their waste and negative environmental impacts result both domestically and in the countries receiving the waste.
The Overloaders
  • The Overloaders are high plastic waste generators that export a significant amount of their waste. Their waste is well managed.
  • Unlike the similarly high-consuming Transactors, the Overloaders import less waste than they export.
The Low-Waste-Producing Polluters
  • Despite their low waste production levels, the Low-Waste-Producing Polluters contribute to plastic pollution levels due to their poor waste management practices.
The Toxic Waste Producers
  • The Toxic Waste Producers are high plastic waste generators, with waste that is mismanaged at high levels.
The Transactors
  • The Transactors are countries with high rates of plastic waste production.
  • Their waste tends to be well-managed, although most do not yet have extensive circular systems for plastics. The Transactors are from wealthy European countries.
  • They export a lot of their waste but also import a lot of waste from neighboring countries.
The Self-Sustainers
  • The Self-Sustainers are moderate plastic waste generators per capita that can to some extent manage their waste internally, although improvements are needed for some of them.

Learn more on Plastic Pollution.

{GS3 – IE – Securities} Nifty Next 50 Index

  • Context (TH): The National Stock Exchange will introduce derivative contracts on Nifty Next 50 index.
  • The Nifty Next 50 index represents 50 companies from Nifty 100 after excluding the Nifty 50 companies.
  • The exchange will offer three serial monthly index futures and index options contract cycles.
  • The cash-settled derivatives contracts will expire on the last Friday of the expiry month.
  • The introduction of derivatives on the Nifty Next 50 index will complement the existing index derivatives product suite.
  • The market capitalisation of Nifty Next 50 index constituents stands at ₹70 trillion representing about 18% of the total market capital of the stocks listed on NSE as on March 29, 2024.

Derivatives

  • Derivatives are financial contracts between two or more parties that derive their value from an underlying asset or benchmark.
  • Broadly, there are two types of derivative contracts: Futures and Options.
    1. A futures contract means a legally binding agreement to buy or sell the underlying security on a future date.
    2. An options contract gives the buyer or holder of the contract the right (but not the obligation) to buy or sell the underlying asset at a predetermined price within or at the end of a specified period.
Sharing is Caring !!

Newsletter Updates

Subscribe to our newsletter and never miss an important update!

Assured Discounts on our New Products!

Leave a Reply

Your email address will not be published. Required fields are marked *

Newsletter

Never miss an important update!