PMF IAS Current Affairs

Richter Magnitude Scale & Earthquakes of Varying Strengths

Richter Magnitude Scale

  • Charles F. Richter developed the Richter magnitude scale (ML) for measuring the strength (amount of energy released) of earthquakes in 1930s.
  • Because of the various shortcomings of the ML scale, seismologists now use moment magnitude scale (Mw).
  • Both the scales are logarithmic and are scaled to have roughly comparable numeric values.
  • Moment magnitude scale Mw scale is now generally referred to as the Richter scale.
  • Under the Richter magnitude scale, an increase of one step corresponds to about 32 times increase in the amount of energy released, and an increase of two steps corresponds to 1,000 times increase in energy.
  • Thus, an earthquake of Mw of 7.0 releases about 32 times as much energy as one of 6.0 and nearly 1,000 times (~ 32 X 32) one of 5.0.
  • Richter scale is only effective for regional earthquakes no greater than M5. Moment magnitude scale is more effective for large earthquakes.

Earthquakes of Varying Strengths

Magnitude

Description

Average earthquake effects

Frequency of occurrence

1.0–1.9 Micro
  • Microearthquakes, not felt, or felt rarely.
  • They are recorded by seismographs.
Several million per year
2.0–2.9 Minor
  • Felt slightly by some people.
  • No damage to buildings.
Over one million per year
3.0–3.9
  • Often felt by people, but very rarely causes damage.
  • Shaking of indoor objects can be noticeable.
Over 100,000 per year
4.0–4.9 Light
  • Noticeable shaking of indoor objects.
  • They are felt by most people in the affected area.
  • Slightly felt outside.
  • Generally, causes none to minimal damage.
  • Some objects may fall off shelves or be knocked over.
10,000 to 15,000 per year
5.0–5.9 Moderate
  • Can cause damage of varying severity to poorly constructed buildings.
  • At most, none to slight damage to all other buildings.
  • Felt by everyone.
1,000 to 1,500 per year

6.0–6.9

Strong

  • Damage to a moderate number of well-built structures in populated areas.
  • Earthquake-resistant structures survive with slight to moderate damage.
  • Poorly designed structures receive moderate to severe damage.
  • Felt in wider areas; up to hundreds of kilometres from the epicentre.
  • Strong to violent shaking in the epicentral area.
100 to 150 per year
  • 2011 Christchurch earthquake (6.2)

7.0–7.9

Major

  • Causes damage to most buildings, some to partially or completely collapse or receive severe damage. Well-designed structures are likely to receive damage. Felt across great distances with major damage mostly limited to 250 km from epicentre.
10 to 20 per year
  • 1819 Rann of Kutch earthquake (7.7–8.2)
  • 2001 Gujarat earthquake (7.7)

8.0–8.9

Great

  • Major damage to buildings, structures likely to be destroyed.
  • Will cause moderate to heavy damage to sturdy or earthquake-resistant buildings.
  • Damaging in large areas.
  • Felt in extremely large regions.
One per year
  • 1556 Shaanxi earthquake (8.0)
  • 1950 Assam–Tibet earthquake (8.6)
  • 2008 Sichuan earthquake (8.0)
  • 2010 Chile earthquake (8.8)

9.0 and greater

  • At or near total destruction – severe damage or collapse to all buildings.
  • Heavy damage and shaking extends to distant locations.
  • Permanent changes in ground topography.
One per 10 to 50 years
  • 1960 Valdivia earthquake, Chile (9.4–9.6)
  • 1964 Alaska earthquake (9.2)
  • 2004 Indian Ocean earthquake (9.1–9.3)
  • 2011 Tōhoku earthquake, Japan (9.1)

Based on U.S. Geological Survey documents

Most powerful earthquakes ever recorded

Event Mw Focus
1 1960 Valdivia earthquake 9.4–9.6 33 km
  • Undersea megathrust earthquake
  • Most powerful earthquake ever recorded
  • The resulting tsunami affected the entire Pacific Rim killing 1,000–7,000 people.
2 1964 Alaska earthquake 9.2 25 km
  • Collapsing structures and tsunamis resulted in 100+ deaths.
3 2004 Indian Ocean earthquake 9.1–9.3 30 km
  • Undersea megathrust earthquake
  • Caused by a rupture along the fault between the Burma Plate and the Indian Plate.
  • A series of large tsunamis up to 30 metres high were created.
  • The earthquake and the resulting tsunami caused the 6th deadliest natural disaster in recorded history with more than 227,000 causalities in 14 countries.
  • The shift of mass and the massive release of energy slightly altered the Earth’s rotation.
4 2011 Tōhoku earthquake 9.1 30 km
  • Undersea megathrust earthquake
  • Most powerful earthquake ever recorded in Japan
  • The earthquake triggered powerful tsunami waves
  • 15,896 causalities
  • Caused Fukushima Daiichi nuclear disaster

Notable Earthquakes

Event Magnitude Notes
1556 Shaanxi earthquake 8.0 Deadliest earthquake with 8,00,000+ fatalities

Most of the deaths were caused due to the collapse of artificial caves carved into the loess cliffs

2011 Tōhoku earthquake and tsunami 9.1 Costliest earthquake that caused damage to property worth $250 billion
1819 Rann of Kutch earthquake 7.7 to 8.2 It triggered a tsunami and caused more than 1000 deaths

The earthquake caused an area of subsidence that formed the Sindri Lake and a local zone of uplift to the north about 80 km long, 6 km wide and 6 m high that dammed the several rivers. This natural dam was known as the Allah Bund (Dam of God).

2001 Gujarat earthquake (Focus: 24 km) 7.7 The earthquake killed between 13000 and 20000 people
  • The Gujarat quake occurred 400 km to the south-east of the tectonic boundary separating Indian Plate and the Eurasian Plate.
  • The current tectonics is governed by the effects of the continuing continental collision along this boundary.
  • The collision has reactivated the original rift faults and development of new thrust faults in the region.
  • The pattern of uplift and subsidence associated with the 1819 Rann of Kutch earthquake is consistent with reactivation of such faults.
  • The area saw many minor earthquakes in the 20th Century including the 2001 earthquake.

Earthquake zones of India

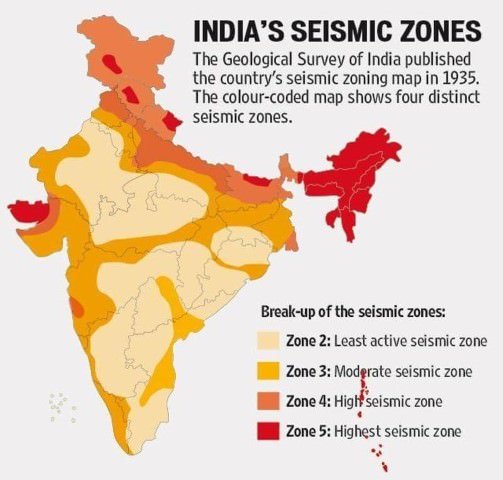
Earthquake zones of India (Source)

  • The latest seismic zone map prepared by the National Disaster Management Authority reveals that nearly 59% of India’s land area is prone to moderate or severe earthquakes.
  • This earthquake zoning map divides India into five different zones of earthquake intensity and highlights the location that falls under them.

Effects of Earthquakes

Shaking and ground rupture
  • Shaking and ground rupture result in severe damage to buildings and other rigid structures.
  • Ground rupture (crack along the fault) is a major risk for large engineering structures such as dams, bridges and nuclear power stations.
Landslides and avalanches
  • Earthquakes, along with severe storms, volcanic activity, coastal wave attack, and wildfires, can produce slope instability leading to landslides, a major geological hazard.
Fires
  • Earthquakes can cause fires by damaging electrical power or gas lines.
  • More deaths in the 1906 San Francisco earthquake were caused by fire than by the earthquake itself.
Soil liquefaction
  • Soil liquefaction occurs when water-saturated soil temporarily loses its strength and transforms from a solid to a liquid. Soil liquefaction may cause rigid structures, like buildings and bridges, to tilt or sink.
Tsunami
  • Megathrust earthquakes can produce long-wavelength, long-period sea waves due to abrupt movement of large volumes of water.
Floods
  • Floods may be secondary effects of earthquakes if dams are damaged.
  • Earthquakes may cause landslips to dam rivers, which collapse and cause floods.
Sharing is Caring !!

Newsletter Updates

Subscribe to our newsletter and never miss an important update!

Assured Discounts on our New Products!

Leave a Reply

Your email address will not be published. Required fields are marked *

Newsletter

Never miss an important update!